Lesson 2
Cracking the codes.
If you’re new to TerraPop/Ipums, or if you want to refresh your memory, go visit the first lesson, HERE or in a blog, HERE.
So far we’ve seen some basic IPUMS-USA/TerraPop Data, and used it to create graphs, and Identify trends. We’ve learned some key vocabulary, and hopefully have a basic concept of how to move around in the CODAP environment.
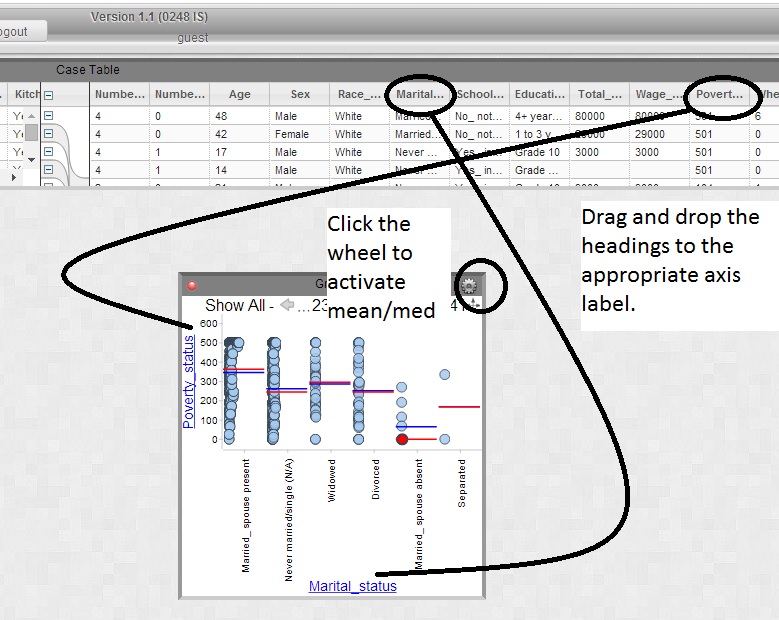
 Start by opening the IPUMS tutorial in the CODAP environment. Click HERE to do that. For this exercise, put Marital_status in the x-axis label, and Poverty_status in the y-axis label. Click the wheel, and turn on mean, and median.
OK, we have a poverty status, and a marital status. What do these codes mean? Marital status seems fairly straightforward, but what does poverty status mean? Let’s look at both. First, go to the IPUMS-USA site. There you can click variables or select data…

We’re looking for Marital_status so first click ‘M’. Then read all the variable labels until we find one we like. MARST is MARITAL STATUS. 
So Click it. Read the description. The comparability. The Universe. The codes.
Description is just that. What are we looking at here. In this case, marital status is relatively clear. But in clicking on comparison we learn that from year to year some terms change. Click on ‘universe.’ How many years of data do we have on ‘marital status?’ Almost 200 years worth of survey data!
But let’s not get overwhelmed by the data. Go back to our CODAP window. Let’s just take a look. What year’s data are we looking at? ONLY 2000. So we’re looking at a sample of Minnesotans, and their married status, in the year 2000. Make sure you read all the codes.
OK, Marital status is pretty normal, married, single, married but spouse absent, widowed. But what about ‘Poverty.’ What do those numbers mean.
Well, follow the above steps to find out what the Poverty level variable means. Again, start at IPUMS-USA. Read about the description, the characteristics, and the codes. Wow quite a bit there. Here is the basic summary. For poverty you get a number between 0 and 501. 100 means you are ‘at the poverty line.’ You are 100% of the poverty line. Any number below 100, and you are in poverty. The higher the number the better off you are.
OK, let’s go back to our CODAP Data. If you can’t find that window, it’s login as guest HERE, create a graph with marital status in the x-axis, poverty status in the y-axis, and click the wheel to turn on mean, and median.
Discussion questions:
What Marital status has the HIGHEST (best) poverty status?
What Marital status has the LOWEST (worst) poverty status?
Which is higher, Widowed, or never married/single?
Discuss these answers. Do any of them surprise you? What are some reasons why Married_spouse absent might have such poverty?
OK one last thing? Why do you think married_spouse present is better off than Never married/single? Does being married make you have more money? Hmm. Try this. On this same graph, drag and drop AGE into the middle. It’s the same graph, it’s just now going to show how old everyone is…

In addition to the different poverty levels, look at the purple slider at the bottom, and the color of the purple dots. What trend can we observe about AGE and POVERTY status from this?
This is a lot of information. If you had to summarize, take one lesson, what is a really undesirable status to be in as far as possibly leading to poverty?
No comments:
Post a Comment